Forecast
Lajamanu (18.3388°S, 130.6367°E, 304m AMSL) set as my default location ›
myMLA

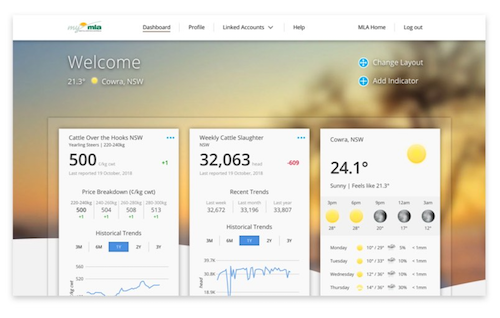 A free online dashboard that provides timely and personalised market indicators and reports, weather, industry news, and other resources to support your business.Learn more
-
Current condition
TODAY
22° 32° possible shower Chance of rain: 60% Likely amount: 1-5mm First
light

Last light Sunrise Sunset 6:32am CST 6:53am CST 6:51pm CST 7:13pm CST NOW25.1° Feels Like: 29.9° Relative Humidity: 94% Dew: 24.1° Wind: E 6km/h Gust: 9km/h Rainfall since 9am: 0.2mm Pressure: 1008.9hPa TODAY
 Possible shower23°33°
 60%
60%
1-5mmLajamanu Now
Temperature 25.1° Feels Like 29.9° Dew Point 24.1° Rel. Humidity 94% Pressure 1008.9hPa Wind E 6km/h Wind Gusts 9km/h Rainfall 0.2mm Updated 3:30 AM24-Hour Graph
6:53am
6:32am
6:51pm
7:13pm -
Lajamanu for Sunday,
LajamanuNow24.1°cFeels Like:27.3°Wind:E 11km/hGusts:13km/hHumidity:95% 22°Min32°MaxToday in LajamanuPartly cloudy. High chance of showers, most likely in the late morning and afternoon. The chance of a thunderstorm. Light winds.Tomorrow
23°Min33°MaxPartly cloudy. High chance of showers, most likely in the afternoon and evening. The chance of a thunderstorm. Light winds.
22°Min32°MaxToday in LajamanuPartly cloudy. High chance of showers, most likely in the late morning and afternoon. The chance of a thunderstorm. Light winds.Tomorrow
23°Min33°MaxPartly cloudy. High chance of showers, most likely in the afternoon and evening. The chance of a thunderstorm. Light winds. -
Radar

-
Radar
-
Warnings
There are no current warnings for Lajamanu
-
48-Hour Weather Forecast
Next 48 Hours
-
7 day forecast
Today: Partly cloudy. High chance of showers, most likely in the late morning and afternoon. The chance of a thunderstorm. Light winds.
Forecast for Lajamanu (18.3388°S, 130.6367°E, 304m AMSL) Sunday
Mar 30Monday
Mar 31Tuesday
Apr 1Wednesday
Apr 2Thursday
Apr 3Friday
Apr 4Saturday
Apr 522° 32° 23° 33° 22° 32° 19° 30° 20° 31° 20° 31° 21° 33° 


Possible shower Possible shower Clearing shower Mostly sunny Mostly sunny Mostly cloudy Mostly sunny Rain Chance 60% 70% 30% 20% 20% 10% 20% Rain Amount 1-5mm 5-10mm < 1mm < 1mm < 1mm < 1mm < 1mm UV index Extreme Extreme Extreme Extreme Extreme Extreme Extreme Fire Danger Rating No Rating No Rating No Rating No Rating - - - Frost risk Nil Nil Nil Nil Nil Nil Nil 9am 3pm 9am 3pm 9am 3pm 9am 3pm 9am 3pm 9am 3pm 9am 3pm 13
(km/h)14
(km/h)15
(km/h)18
(km/h)17
(km/h)23
(km/h)13
(km/h)10
(km/h)22
(km/h)18
(km/h)20
(km/h)19
(km/h)22
(km/h)24
(km/h)Wind NNE NNE N NNW NW WNW SSW WSW SE ESE SE ESE SE ESE Humidity 92% 67% 89% 59% 86% 55% 82% 51% 76% 53% 64% 42% 61% 44% Dew point 23°C 25°C 24°C 24°C 22°C 22°C 18°C 19°C 19°C 20°C 17°C 17°C 17°C 20°C First light 6:32am 6:32am 6:32am 6:32am 6:32am 6:33am 6:33am Sunrise 6:53am 6:54am 6:54am 6:54am 6:54am 6:54am 6:55am Sunset 6:51pm 6:50pm 6:49pm 6:48pm 6:47pm 6:47pm 6:46pm Last light 7:13pm 7:12pm 7:11pm 7:10pm 7:09pm 7:09pm 7:08pm -
Popup - Daily historical
-
-
Popup - Monthly historical
 Sign in to myMLA for deeper weather insights.28 Day and 12 Month Rainfall forecast
Detailed Historical Observations and Climatology


