

Australian Government Bureau of Meteorology
New South Wales
Coastal Hazard Warning
for DAMAGING SURF
for parts of Hunter, Metropolitan, Illawarra, South Coast and Mid North Coast Forecast Districts.
Issued at 4:45 am Sunday, 30 March 2025.
Damaging Surf to develop along parts of the New South Wales coast during Sunday afternoon and evening and intensify further during Monday.
Weather Situation
A low pressure system off the southeast NSW coast will deepen during Sunday as it moves offshore into the southern Tasman Sea. Strong to gale-force southeast to southerly winds around the low will generate large and powerful waves for parts of the NSW coast.
DAMAGING SURF for the following areas:
Mid North Coast, Hunter, Metropolitan, Illawarra and South Coast
VERY HEAVY SURF which may lead to localised damage and coastal erosion is possible along the New South Wales coast south of Seal Rocks from Sunday afternoon and evening, becoming more likely during Monday.
Beach conditions in these areas could be dangerous and people should stay well away from the surf and surf exposed areas, particularly south-facing coastlines.
A Hazardous Surf Warning is also current for parts of the New South Wales Coast.
A Severe Weather Warning for Damaging Winds and Heavy Rainfall is also current.
For all the latest warnings refer to http://www.bom.gov.au/nsw/warnings/
Locations which may be affected include Stockton Beach, Newcastle, Sydney, Wollongong, Batemans Bay, Moruya Heads and Eden.
The State Emergency Service advises that people should:
* Stay vigilant and monitor conditions.
* For emergency help in floods and storms, ring your local SES Unit on 132 500.
The next Coastal Hazard Warning will be issued by 11:00 am AEDT Sunday.
Warnings are also available through TV and Radio broadcasts, the Bureau's website at www.bom.gov.au or call 1300 659 210. The Bureau and State Emergency Service would appreciate warnings being broadcast regularly.
Forecast
Nerriga (35.1132°S, 150.0887°E, 613m AMSL) set as my default location ›
myMLA

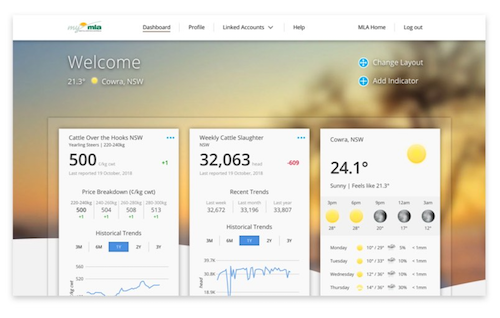 A free online dashboard that provides timely and personalised market indicators and reports, weather, industry news, and other resources to support your business.Learn more
-
Current condition
TODAY
15° 16° Chance of rain: 90% Likely amount: 5-10mm First
light

Last light Sunrise Sunset 6:45am EDT 7:10am EDT 6:58pm EDT 7:23pm EDT NOW15.1° Feels Like: 10.8° Relative Humidity: 96% Dew: 14.5° Wind: S 30km/h Gust: 52km/h Rainfall since 9am: 16.4mm Pressure: 1012.2hPa TODAY
 Showers14°17°
 90%
90%
5-10mmNerriga Now
Temperature 15.1° Feels Like 10.8° Dew Point 14.5° Rel. Humidity 96% Pressure 1012.2hPa Wind S 30km/h Wind Gusts 52km/h Rainfall 16.4mm Updated 8:00 AM24-Hour Graph
7:10am
6:45am
6:58pm
7:23pm -
Nerriga for Sunday,
NerrigaNow14.4°cFeels Like:9.4°Wind:S 32km/hGusts:44km/hHumidity:94% 15°Min16°MaxToday in NerrigaCloudy. Very high chance of showers in the E, medium chance elsewhere. Winds S 30 to 45 km/h. Daytime maximum temperatures between 17 and 24.Tomorrow
14°Min17°MaxPartly cloudy. Medium chance of showers in the E, slight chance elsewhere. Winds S 25 to 35 km/h. Overnight temperatures falling to between 9 and 12 with daytime temperatures reaching between 18 and 23.
15°Min16°MaxToday in NerrigaCloudy. Very high chance of showers in the E, medium chance elsewhere. Winds S 30 to 45 km/h. Daytime maximum temperatures between 17 and 24.Tomorrow
14°Min17°MaxPartly cloudy. Medium chance of showers in the E, slight chance elsewhere. Winds S 25 to 35 km/h. Overnight temperatures falling to between 9 and 12 with daytime temperatures reaching between 18 and 23. -
Radar

-
Radar
-
Warnings
Weather Warnings
Sun 4:45am UTC - NSWSun 4:45am UTC - NSWAustralian Government Bureau of Meteorology
New South Wales
Coastal Hazard Warning
for DAMAGING SURF
for parts of Hunter, Metropolitan, Illawarra, South Coast and Mid North Coast Forecast Districts.
Issued at 4:45 am Sunday, 30 March 2025.
Damaging Surf to develop along parts of the New South Wales coast during Sunday afternoon and evening and intensify further during Monday.
Weather Situation
A low pressure system off the southeast NSW coast will deepen during Sunday as it moves offshore into the southern Tasman Sea. Strong to gale-force southeast to southerly winds around the low will generate large and powerful waves for parts of the NSW coast.
DAMAGING SURF for the following areas:
Mid North Coast, Hunter, Metropolitan, Illawarra and South Coast
VERY HEAVY SURF which may lead to localised damage and coastal erosion is possible along the New South Wales coast south of Seal Rocks from Sunday afternoon and evening, becoming more likely during Monday.
Beach conditions in these areas could be dangerous and people should stay well away from the surf and surf exposed areas, particularly south-facing coastlines.
A Hazardous Surf Warning is also current for parts of the New South Wales Coast.
A Severe Weather Warning for Damaging Winds and Heavy Rainfall is also current.
For all the latest warnings refer to http://www.bom.gov.au/nsw/warnings/
Locations which may be affected include Stockton Beach, Newcastle, Sydney, Wollongong, Batemans Bay, Moruya Heads and Eden.
The State Emergency Service advises that people should:
* Stay vigilant and monitor conditions.
* For emergency help in floods and storms, ring your local SES Unit on 132 500.
The next Coastal Hazard Warning will be issued by 11:00 am AEDT Sunday.
Warnings are also available through TV and Radio broadcasts, the Bureau's website at www.bom.gov.au or call 1300 659 210. The Bureau and State Emergency Service would appreciate warnings being broadcast regularly.Sun 4:35am UTC - NSWAustralian Government Bureau of Meteorology
New South Wales
Warning to Sheep Graziers
for Illawarra, South Coast, Snowy Mountains and Australian Capital Territory forecast districts
Issued at 04:35 AM EDT on Sunday 30 March 2025
Warning to Sheep Graziers for the following areas:
Illawarra, South Coast, Snowy Mountains and Australian Capital Territory forecast districts
Sheep graziers are warned that cold temperatures, rain, showers and southerly winds are expected during Sunday and Monday. Areas likely to be affected include the Snowy Mountains forecast district and parts of the Illawarra, South Coast and Australian Capital Territory forecast districts. There is a risk of losses of lambs and sheep exposed to these conditions.
Cancellation of Warning to Sheep Graziers for the following areas:
Southern Tablelands forecast district
The Warning to Sheep Graziers for the Southern Tablelands forecast district has been cancelled.
The next warning will be issued by 11:00 am EDT Sunday.Sun 4:34am UTC - NSWAustralian Government Bureau of Meteorology
New South Wales
Hazardous Surf Warning for New South Wales
Issued at 04:34 AM EDT on Sunday 30 March 2025
Weather Situation
Surf and swell conditions are expected to be hazardous for coastal activities such as rock fishing, boating, and swimming in the following areas.
Hazardous Surf Warning for the following areas:
Hunter Coast, Sydney Coast, Illawarra Coast, Batemans Coast and Eden Coast
Warnings for Monday 31 March
Hazardous Surf Warning for the following areas:
Hunter Coast, Sydney Coast, Illawarra Coast, Batemans Coast and Eden Coast
NSW Police Force, Marine Area Command advise that:
People should consider staying out of the water and avoid walking near surf-exposed areas.
Rock fishers should avoid coastal rock platforms exposed to the ocean and seek a safe location that is sheltered from the surf.
Boaters planning to cross shallow water and ocean bars should consider changing or delaying their voyage.
Boaters already on the water should carry the appropriate safety equipment and wear a lifejacket.
Boaters should remember to log on with their local Marine Rescue radio base, via VHF Radio or the Marine Rescue APP, and consider their safety management plan.
The next warning will be issued by 5:00 pm EDT Sunday.
================================================================================
Check the Coastal Waters Forecast for information
on wind, wave and weather conditions for
these areas at http://www.bom.gov.au/nsw/ or on marine
radio.
================================================================================Sun 4:10am UTC - NSWAustralian Government Bureau of Meteorology
New South Wales
Marine Wind Warning Summary for New South Wales
Issued at 04:10 AM EDT on Sunday 30 March 2025
for the period until midnight EDT Monday 31 March 2025
Wind Warnings for Sunday 30 March
Gale Warning for the following areas:
Sydney Enclosed Waters, Hunter Coast, Sydney Coast, Illawarra Coast, Batemans Coast and Eden Coast
Strong Wind Warning for the following areas:
Coffs Coast and Macquarie Coast
Cancellation for the following areas:
Byron Coast
Wind Warnings for Monday 31 March
Gale Warning for the following areas:
Hunter Coast, Sydney Coast, Illawarra Coast, Batemans Coast and Eden Coast
Strong Wind Warning for the following areas:
Sydney Enclosed Waters, Coffs Coast and Macquarie Coast
The next marine wind warning summary will be issued by 4:05 pm EDT Sunday.
================================================================================
Check the latest Coastal Waters Forecast or Local
Waters Forecast at http://www.bom.gov.au/nsw/forecasts/map.shtml for information on wind,
wave and weather conditions for these coastal zones.
================================================================================- DAMAGING Surf for Sydney Metropolitan, Hunter, Illawarra & Mid North and South coasts
- DAMAGING Surf for Sydney Metropolitan, Hunter, Illawarra & Mid North and South coasts
- Sheep Graziers Warning Illawarra, Snowy Mountains, ACT & South Coast. Cancelled Sheep Graziers Warning Southern Tablelands
- Hazardous Surf Warning for Hunter, Sydney, Illawarra, Batemans and Eden coasts
- Gale Warning Sydney Enclosed Waters & Hunter, Sydney, Illawarra, Batemans & Edens. Strong Wind Warning Coffs & Macquaries. Cancelled Byron
-
48-Hour Weather Forecast
Next 48 Hours
-
7 day forecast
Today: Cloudy. Very high chance of showers in the E, medium chance elsewhere. Winds S 30 to 45 km/h. Daytime maximum temperatures between 17 and 24.
Forecast for Nerriga (35.1132°S, 150.0887°E, 613m AMSL) Sunday
Mar 30Monday
Mar 31Tuesday
Apr 1Wednesday
Apr 2Thursday
Apr 3Friday
Apr 4Saturday
Apr 515° 16° 14° 17° 10° 19° 9° 20° 9° 22° 10° 20° 9° 19° 


Showers Showers Mostly sunny Mostly cloudy Mostly sunny Mostly sunny Mostly sunny Rain Chance 90% 70% 10% 20% 20% 10% 5% Rain Amount 5-10mm 1-5mm < 1mm < 1mm < 1mm < 1mm < 1mm UV index High High High High High High High Fire Danger Rating Moderate Moderate Moderate Moderate - - - Frost risk Nil Nil Nil Nil Nil Nil Nil 9am 3pm 9am 3pm 9am 3pm 9am 3pm 9am 3pm 9am 3pm 9am 3pm 25
(km/h)24
(km/h)22
(km/h)23
(km/h)13
(km/h)16
(km/h)4
(km/h)7
(km/h)6
(km/h)10
(km/h)5
(km/h)8
(km/h)11
(km/h)17
(km/h)Wind SSW SSW SSW SSW SW SSW WNW WNW W W N NNW WNW NW Humidity 94% 92% 87% 70% 72% 49% 79% 50% 73% 36% 80% 45% 62% 42% Dew point 15°C 15°C 12°C 12°C 8°C 8°C 9°C 10°C 8°C 6°C 10°C 8°C 7°C 6°C First light 6:45am 6:46am 6:47am 6:47am 6:48am 6:49am 6:50am Sunrise 7:10am 7:11am 7:12am 7:13am 7:13am 7:14am 7:15am Sunset 6:58pm 6:57pm 6:55pm 6:54pm 6:52pm 6:51pm 6:50pm Last light 7:23pm 7:22pm 7:21pm 7:19pm 7:18pm 7:16pm 7:15pm -
Popup - Daily historical
-
-
Popup - Monthly historical
 Sign in to myMLA for deeper weather insights.28 Day and 12 Month Rainfall forecast
Detailed Historical Observations and Climatology
