

Australian Government Bureau of Meteorology, New South Wales
Minor Flood Warning For The Barwon River
Issued at 03:17 PM EST on Monday 07 April 2025
Flood Warning Number: 5
MINOR FLOODING OCCURRING AT MUNGINDI AND WALGETT
MINOR FLOODING LIKELY AT MOGIL MOGIL LATE MONDAY EVENING AND AT COLLARENEBRI AROUND THURSDAY
Floodwaters from the Macintyre, Weir, Moonie and Gwydir Rivers combined with local runoff have caused river level rises along the Barwon River between Mungindi and Collarenebri. Minor flooding is occurring at Mungindi and likely at Mogil Mogil late Monday evening and Collarenebri Thursday this week.
Further downstream along the Barwon River, minor flooding is occurring at Walgett, caused by flows from the Namoi River,
Barwon River Mungindi to Collarenebri:
Minor flooding is occurring along the Barwon River at Mungindi and likely at Mogil Mogil and Collarenebri.
The Barwon River at Mungindi is currently at 6.14 metres and falling, above the minor flood level (6.10 m).
The Barwon River at Mungindi may fall below the minor flood level (6.10 m) overnight Monday into Tuesday. Renewed river level rises and minor flooding are likely at Mungindi as more floodwaters from the Macintyre and Weir rivers arrive. The river level may reach around 6.60 metres later this week with minor flooding. Further rises are possible.
The Barwon River at Mogil Mogil is currently at 7.40 metres and rising slowly, below the minor flood level (7.50 m).
The Barwon River at Mogil Mogil is likely to reach the minor flood level (7.50 m) late Monday evening. Further rises are possible.
The Barwon River at Collarenebri is currently at 4.63 metres and rising, below the minor flood level (5.80 m).
The Barwon River at Collarenebri may reach the minor flood level (5.80 m) around Thursday. Further rises are possible.
Barwon River downstream of Collarenebri to Walgett:
Minor flooding is occurring along the Barwon River downstream of Collarenebri to Walgett.
The Barwon River at Walgett is currently at 11.15 metres and rising, above the minor flood level (10.50 m).
The Barwon River at Walgett may reach around 11.30 metres during Tuesday. Further rises are possible.
Flood Safety Advice:
In life threatening emergencies, call 000 (triple zero) immediately. If you require rescue, assistance to evacuate or other emergency help, ring NSW SES on 132 500.
* Avoid drowning. Stay out of rising water, seek refuge in the highest available place.
* Prevent damage to your vehicle. Move it under cover, away from areas likely to flood.
* Avoid being swept away. Stay out of fast-flowing creeks and storm drains.
* Never drive, ride or walk through flood water. Flood water can be deceptive and dangerous.}
For more emergency information, advice, and access to the latest river heights and rainfall observations and forecasts:
* NSW SES: www.ses.nsw.gov.au
* RMS Live Traffic: www.livetraffic.com
* Latest River Heights and Rainfall Observations: www.bom.gov.au/nsw/flood/outerwest.shtml
* Latest NSW Warnings: www.bom.gov.au/nsw/warnings/
* Rainfall Forecasts: www.bom.gov.au/australia/meteye/
* BOM NSW Twitter: www.twitter.com/BOM_NSW
Next issue:
The next warning will be issued by 04:00 pm EST on Tuesday 08 April 2025.
Latest River Heights:
Barwon River at Eagle Farm,6.16,Steady,03:00 PM MON 07/04/25
Barwon River at Mungindi,6.14,Falling,03:00 PM MON 07/04/25
Barwon River at Mogil Mogil,7.40,Rising,03:00 PM MON 07/04/25
Barwon River at Collarenebri,4.63,Rising,03:00 PM MON 07/04/25
Barwon River at Walgett,11.15,Rising,03:00 PM MON 07/04/25
Barwon River at Brewarrina,3.07,Steady,03:00 PM MON 07/04/25
Darling River at Bourke,5.33,Steady,03:00 PM MON 07/04/25
Darling River at Louth,2.82,Steady,02:45 PM MON 07/04/25
Darling River at Tilpa,1.68,Steady,02:15 PM MON 07/04/25
Darling River at Wilcannia,0.60,Steady,03:00 PM MON 07/04/25
Darling River at Nelia Gaari,60.11,Steady,03:00 PM MON 07/04/25
Darling River at Menindee Town,3.65,Steady,03:00 PM MON 07/04/25
Darling River at Menindee Weir 32,1.73,Steady,03:00 PM MON 07/04/25
Channel Outlet at Lake Cawndilla,54.48,Steady,03:00 PM MON 07/04/25
Great Darling Anabranch at Offtake,2.00,Steady,03:00 PM MON 07/04/25
Great Darling Anabranch at Wycot,1.33,Steady,03:00 PM MON 07/04/25
Darling River at Pooncarie,2.31,Steady,03:00 PM MON 07/04/25
Darling Anabranch at U/S Dam,0.63,Steady,03:00 PM MON 07/04/25
Darling Anabranch at D/S Dam,1.72,Steady,03:00 PM MON 07/04/25
Darling River at Burtundy,0.99,Steady,03:00 PM MON 07/04/25
Great Darling Anabranch at Bulpunga,1.13,Steady,03:00 PM MON 07/04/25
Great Darling Anabranch at Tara Downs,0.76,Steady,03:00 PM MON 07/04/25
This advice is also available by dialling 1300 659 210. Warning, rainfall and river information are available at www.bom.gov.au/nsw/flood. The latest weather forecast is available at www.bom.gov.au/nsw/forecasts.
Forecast
Forbes (33.3853°S, 148.0079°E, 233m AMSL) set as my default location ›
myMLA

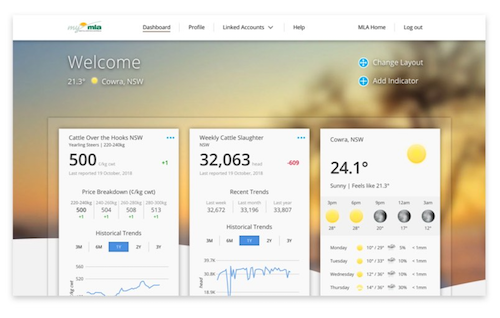 A free online dashboard that provides timely and personalised market indicators and reports, weather, industry news, and other resources to support your business.Learn more
-
Current condition
TOMORROW
6° 25° Chance of rain: 5% Likely amount: < 1mm First
light

Last light Sunrise Sunset 6:00am EST 6:25am EST 5:55pm EST 6:20pm EST NOW20.1° Feels Like: 16.5° Relative Humidity: 38% Dew: 5.4° Wind: SW 13km/h Gust: 17km/h Rainfall since 9am: 0.0mm Pressure: 1020.3hPa TODAY
 Sunny6°25°
 5%
5%
< 1mmForbes Now
Temperature 20.1° Feels Like 16.5° Dew Point 5.4° Rel. Humidity 38% Pressure 1020.3hPa Wind SW 13km/h Wind Gusts 17km/h Rainfall 0.0mm Updated 6:00 PM24-Hour Graph
6:25am
6:00am
5:55pm
6:20pm -
Forbes for Monday,
ForbesNow19.5°cFeels Like:15.1°Wind:SW 17km/hGusts:24km/hHumidity:38% 6°Min25°MaxToday in ForbesSunny. Light winds. Overnight temperatures falling to between 5 and 12 with daytime temperatures reaching the mid to high 20s.Tomorrow
6°Min25°MaxSunny. Winds E/SE 15 to 20 km/h tending E/NE in the morning then becoming light in the middle of the day. Overnight temperatures falling to between 7 and 12 with daytime temperatures reaching the high 20s.
6°Min25°MaxToday in ForbesSunny. Light winds. Overnight temperatures falling to between 5 and 12 with daytime temperatures reaching the mid to high 20s.Tomorrow
6°Min25°MaxSunny. Winds E/SE 15 to 20 km/h tending E/NE in the morning then becoming light in the middle of the day. Overnight temperatures falling to between 7 and 12 with daytime temperatures reaching the high 20s. -
Radar

-
Radar
-
Warnings
Weather Warnings
Mon 3:17pm UTC - NSWMon 1:33pm UTC - NSWAustralian Government Bureau of Meteorology, New South Wales
Moderate Flood Warning For The Namoi River
Issued at 01:33 PM EST on Monday 07 April 2025
Flood Warning Number: 15
MODERATE FLOODING OCCURRING AT BUGILBONE AND GOANGRA
Moderate flooding continues along the Namoi River at Bugilbone, where river levels are falling slowly following a flood peak last Tuesday.
Further downstream, the flood peak along the Namoi River is now approaching Goangra, where river levels are currently near the moderate flood level and rising.
Namoi River:
Moderate flooding is occurring at Bugilbone and Goangra
The Namoi River at Bugilbone is currently at 5.86 metres and falling, above the moderate flood level (5.50 m).
The Namoi River at Bugilbone is likely to remain above the moderate flood level (5.50 m) for the next few days.
The Namoi River at Goangra is currently at 6.69 metres and rising, near the moderate flood level (6.70 m).
The Namoi River at Goangra may peak around 7.00 metres overnight Monday into Tuesday, with moderate flooding.
Flood Safety Advice:
In life threatening emergencies, call 000 (triple zero) immediately. If you require rescue, assistance to evacuate or other emergency help, ring NSW SES on 132 500.
* Avoid drowning. Stay out of rising water, seek refuge in the highest available place.
* Prevent damage to your vehicle. Move it under cover, away from areas likely to flood.
* Avoid being swept away. Stay out of fast-flowing creeks and storm drains.
* Never drive, ride or walk through flood water. Flood water can be deceptive and dangerous.}
For more emergency information, advice, and access to the latest river heights and rainfall observations and forecasts:
* NSW SES: www.ses.nsw.gov.au
* RMS Live Traffic: www.livetraffic.com
* Latest River Heights and Rainfall Observations: www.bom.gov.au/nsw/flood/northwest.shtml
* Latest NSW Warnings: www.bom.gov.au/nsw/warnings/
* Rainfall Forecasts: www.bom.gov.au/australia/meteye/
* BOM NSW Twitter: www.twitter.com/BOM_NSW
Next issue:
The next warning will be issued by 02:00 pm EST on Tuesday 08 April 2025.
Latest River Heights:
Peel River at Piallamore,1.16,Steady,12:45 PM MON 07/04/25
Cockburn River at Mulla Crossing,0.55,Steady,12:00 PM MON 07/04/25
Peel River at Tamworth Road Bridge,0.21,Steady,12:45 PM MON 07/04/25
Peel River at Carrol Gap,1.16,Falling,12:45 PM MON 07/04/25
Namoi River at Manilla,1.41,Steady,12:45 PM MON 07/04/25
Mooki River at Breeza Station,0.81,Steady,12:45 PM MON 07/04/25
Namoi River at Gunnedah,0.87,Steady,12:45 PM MON 07/04/25
Coxs Creek at Boggabri,1.32,Falling,12:45 PM MON 07/04/25
Namoi River at Boggabri,1.65,Falling,12:45 PM MON 07/04/25
Narrabri Creek at Narrabri,1.39,Falling,12:45 PM MON 07/04/25
Namoi River at Wee Waa (Glencoe),1.70,Falling,12:45 PM MON 07/04/25
Namoi River at Bugilbone,5.86,Falling,12:45 PM MON 07/04/25
Namoi River at Goangra,6.69,Rising,12:45 PM MON 07/04/25
This advice is also available by dialling 1300 659 210. Warning, rainfall and river information are available at www.bom.gov.au/nsw/flood. The latest weather forecast is available at www.bom.gov.au/nsw/forecasts. -
48-Hour Weather Forecast
Next 48 Hours
-
7 day forecast
Today: Sunny. Light winds. Overnight temperatures falling to between 5 and 12 with daytime temperatures reaching the mid to high 20s.
Forecast for Forbes (33.3853°S, 148.0079°E, 233m AMSL) Tuesday
Apr 8Wednesday
Apr 9Thursday
Apr 10Friday
Apr 11Saturday
Apr 12Sunday
Apr 13Monday
Apr 146° 25° 8° 29° 13° 29° 13° 31° 13° 31° 14° 31° 14° 30° 


Sunny Mostly sunny Mostly cloudy Mostly sunny Mostly sunny Mostly sunny Mostly sunny Rain Chance 5% 5% 20% 10% 5% 5% 10% Rain Amount < 1mm < 1mm < 1mm < 1mm < 1mm < 1mm < 1mm UV index High High High High High High High Fire Danger Rating Moderate Moderate Moderate Moderate - - - Frost risk Nil Nil Nil Nil Nil Nil Nil 9am 3pm 9am 3pm 9am 3pm 9am 3pm 9am 3pm 9am 3pm 9am 3pm 6
(km/h)7
(km/h)8
(km/h)10
(km/h)13
(km/h)10
(km/h)6
(km/h)7
(km/h)11
(km/h)11
(km/h)10
(km/h)7
(km/h)9
(km/h)7
(km/h)Wind SSE SW ENE N NNE N NNE S ESE ESE E SE ENE SSW Humidity 53% 27% 59% 26% 54% 30% 52% 26% 53% 25% 58% 27% 56% 27% Dew point 7°C 4°C 11°C 7°C 13°C 9°C 12°C 8°C 12°C 8°C 13°C 9°C 13°C 9°C First light 6:00am 6:01am 6:01am 6:02am 6:03am 6:03am 6:04am Sunrise 6:25am 6:26am 6:26am 6:27am 6:28am 6:28am 6:29am Sunset 5:55pm 5:54pm 5:53pm 5:52pm 5:50pm 5:49pm 5:48pm Last light 6:20pm 6:19pm 6:18pm 6:17pm 6:15pm 6:14pm 6:13pm -
Popup - Daily historical
-
-
Popup - Monthly historical
 Sign in to myMLA for deeper weather insights.28 Day and 12 Month Rainfall forecast
Detailed Historical Observations and Climatology
